Friday, August 3, 2018

Caterpillar (CAT) Stock Is a Strong Buy Despite Tariff Concerns

Shares of Caterpillar (CAT ) have slipped since the company reported exceptional second-quarter financial results Monday as investors worry trade war tensions and tariffs will harm CAT going forward. But Caterpillar raised its 2018 guidance and both the company and its stock look strong.

Q2 Overview

Caterpillar posted quarterly revenues of $14 billion, which marked a 24% climb from the year-ago period and topped the $13.7 billion Zacks Consensus Estimate. CAT’s adjusted quarterly earnings soared 99% to hit $2.97 share, also coming in well above our estimate.

The company raised its adjusted fiscal 2018 earnings guidance from between $10.25 to $11.25 per share up to the $11.00 to $12.00 per share range. “Based on outstanding results in the first half of the year and continued strength in many of our end markets, Caterpillar is again raising our profit outlook for 2018,” Caterpillar CEO Jim Umpleby said in a statement.

Investors should also note that CAT’s second-quarter Machinery, Energy & Transportation operating cash flow was $2.1 billion. Meanwhile, the construction and mining giant repurchased $750 million shares of common stock and announced in June that it upped its quarterly dividend of 10% to $0.86 per share.

All of this should have inspired confidence from investors, but it seems that the Trump administration’s tariffs and trade war fears between the world’s two largest economies scared away investors. Plus, CAT did, in fact, say that the “recently imposed tariffs are expected to impact material costs in the second half of the year by approximately $100 million to $200 million, and the company expects supply chain challenges to continue to pressure freight costs.” Still, Caterpillar raised its full-year outlook because the firm plans to offset these impacts through mid-year price increases and spending discipline.

Furthermore, CAT is set to return value to investors through a new round of buybacks. Caterpillar’s board authorized a new share repurchase plan of up to $10 billion of common stock, effective at the start of 2019—with no expiration date. Meanwhile, the firm’s current plan, which expires this year, has $4.2 billion left in repurchases to be made.

Price Movement

Now that we have covered Caterpillar’s strong second quarter and hopefully lessened any major worries due to the increased negative trade and tariff rhetoric, let’s take a look at CAT’s price movement. The company finished 2017 as the second-best performing Dow stock, up 70%. However, shares of CAT are up just roughly 22% over the last year. And CAT has seen its stock price fall 12% since the start of 2018.


Valuation

CAT stock is currently trading at 12.1X forward 12-month Zacks Consensus EPS estimates, which marks a discount compared to its industry’s 15.5X average—which includes Deere (DE ) , Terex (TEX ) , and Manitowoc (MTW ) —as well as the S&P’s 17.2X.

Over the last year, Caterpillar has traded as high as 24.7X, with a one-year median of 18.7X. CAT stock has also traded as high as 32.6X during the last two years, which it hit in January 2017. Caterpillar is currently trading just slightly above its three-year low of 11.8X. Therefore, Caterpillar stock is pretty attractive at its current valuation.  Coupled with the fact that its actual stock price is technically less expensive than it has been recently, resting below its 52-week high, CAT stock might just be a steal at the moment.


Growth Outlook

Our current Zacks Consensus Estimate is calling for Caterpillar’s third-quarter revenues to hit $13.13 billion, which would mark a 15% climb from the year-ago period. For the full year, the company’s revenues are projected to surge by over 19.5% to touch $54.33 billion. 

Caterpillar’s adjusted Q3 earnings are projected to skyrocket by 41% to reach $2.75 per share. The company’s full-year earnings are expected to reach $11.39 per share, representing over a 65% expansion.

CAT has earned six earnings estimate revisions for Q3, with nearly 100% agreement to the upside, all within the last seven days. The company has also received eight full-year and nine fiscal 2019 upward earnings revisions during this same timeframe, against zero downward changes.

Caterpillar is currently a Zacks Rank #1 (Strong Buy) and sports an “A” grade for Momentum and a “B” for Value in our Style Scores system. 

Today's Stocks from Zacks' Hottest Strategies

It's hard to believe, even for us at Zacks. But while the market gained +21.9% in 2017, our top stock-picking screens have returned +115.0%, +109.3%, +104.9%, +98.6%, and +67.1%.

And this outperformance has not just been a recent phenomenon. Over the years it has been remarkably consistent. From 2000 - 2017, the composite yearly average gain for these strategies has beaten the market more than 19X over. Maybe even more remarkable is the fact that we're willing to share their latest stocks with you without cost or obligation.

See Them Free>>

Wednesday, August 1, 2018

Burns J W & Co Inc Buys Zoetis Inc, Occidental Petroleum Corp, NVIDIA Corp, Sells Bristol-Myers Squi

Investment company Burns J W & Co Inc buys Zoetis Inc, Occidental Petroleum Corp, NVIDIA Corp, Monster Beverage Corp, sells Bristol-Myers Squibb Company, Invesco S&P 500 Equal Weight, Philip Morris International Inc, Invesco S&P 500 Quality, Naspers during the 3-months ended 2018-06-30, according to the most recent filings of the investment company, Burns J W & Co Inc. As of 2018-06-30, Burns J W & Co Inc owns 161 stocks with a total value of $389 million. These are the details of the buys and sells.

New Purchases: ZTS, NVDA, MNST, Added Positions: OXY, XLI, SPY, FDX, AMZN, PYPL, XLK, IJH, STZ, BA, Reduced Positions: BMY, PM, DLX, CELG, V, PG, MSFT, SLB, ORCL, MO, Sold Out: RSP, SPHQ, NPSNY, DE, GD, MPC,

For the details of BURNS J W & CO INC's stock buys and sells, go to http://www.gurufocus.com/StockBuy.php?GuruName=BURNS+J+W+%26+CO+INC

These are the top 5 holdings of BURNS J W & CO INCVisa Inc (V) - 152,993 shares, 5.2% of the total portfolio. Shares reduced by 1.96%Apple Inc (AAPL) - 108,505 shares, 5.16% of the total portfolio. Shares reduced by 0.76%Microsoft Corp (MSFT) - 179,898 shares, 4.56% of the total portfolio. Shares reduced by 1.77%PepsiCo Inc (PEP) - 97,782 shares, 2.73% of the total portfolio. Shares reduced by 0.19%Chevron Corp (CVX) - 66,114 shares, 2.15% of the total portfolio. Shares reduced by 0.25%New Purchase: Zoetis Inc (ZTS)

Burns J W & Co Inc initiated holding in Zoetis Inc. The purchase prices were between $79.9 and $89.2, with an estimated average price of $84.43. The stock is now traded at around $85.29. The impact to a portfolio due to this purchase was 0.19%. The holding were 8,483 shares as of 2018-06-30.

New Purchase: NVIDIA Corp (NVDA)

Burns J W & Co Inc initiated holding in NVIDIA Corp. The purchase prices were between $214.25 and $266.91, with an estimated average price of $242.85. The stock is now traded at around $250.89. The impact to a portfolio due to this purchase was 0.09%. The holding were 1,552 shares as of 2018-06-30.

New Purchase: Monster Beverage Corp (MNST)

Burns J W & Co Inc initiated holding in Monster Beverage Corp. The purchase prices were between $48.09 and $57.68, with an estimated average price of $54.03. The stock is now traded at around $61.58. The impact to a portfolio due to this purchase was 0.05%. The holding were 3,537 shares as of 2018-06-30.

Added: Occidental Petroleum Corp (OXY)

Burns J W & Co Inc added to a holding in Occidental Petroleum Corp by 31.89%. The purchase prices were between $64.67 and $86.48, with an estimated average price of $79.81. The stock is now traded at around $83.08. The impact to a portfolio due to this purchase was 0.15%. The holding were 28,982 shares as of 2018-06-30.

Sold Out: Invesco S&P 500 Equal Weight (RSP)

Burns J W & Co Inc sold out a holding in Invesco S&P 500 Equal Weight. The sale prices were between $97.3 and $104.54, with an estimated average price of $101.37.

Sold Out: Invesco S&P 500 Quality (SPHQ)

Burns J W & Co Inc sold out a holding in Invesco S&P 500 Quality. The sale prices were between $29.15 and $31.29, with an estimated average price of $30.22.

Sold Out: Naspers Ltd (NPSNY)

Burns J W & Co Inc sold out a holding in Naspers Ltd. The sale prices were between $45.69 and $53.48, with an estimated average price of $49.83.

Sold Out: Deere & Co (DE)

Burns J W & Co Inc sold out a holding in Deere & Co. The sale prices were between $134.75 and $159, with an estimated average price of $147.34.

Sold Out: General Dynamics Corp (GD)

Burns J W & Co Inc sold out a holding in General Dynamics Corp. The sale prices were between $185.89 and $225.96, with an estimated average price of $204.8.

Sold Out: Marathon Petroleum Corp (MPC)

Burns J W & Co Inc sold out a holding in Marathon Petroleum Corp. The sale prices were between $69.2 and $82.93, with an estimated average price of $76.33.


Here is the complete portfolio of BURNS J W & CO INC. Also check out:

1. BURNS J W & CO INC's Undervalued Stocks
2. BURNS J W & CO INC's Top Growth Companies, and
3. BURNS J W & CO INC's High Yield stocks
4. Stocks that BURNS J W & CO INC keeps buying

Saturday, July 21, 2018

Zacks Investment Research Downgrades Brink’s (BCO) to Sell

Brink’s (NYSE:BCO) was downgraded by Zacks Investment Research from a “hold” rating to a “sell” rating in a research note issued to investors on Friday.

According to Zacks, “The Brink’s Company is the world’s largest cash management company. Brinks customers include financial institutions, retailers, government agencies (including central banks and mints), jewelers and other commercial operations around the world. Brinks strong market position is supported by a new leadership with a proven track record of success, a strategic long-term strategy to drive growth and the financial strength to continue to capture market share. Brinks culture of continuous improvement is supported by a global team dedicated to providing exceptional customer support. Brink’s is a global leader in business and security services. The Company’s three businesses are Brink’s, Incorporated, the world’s premier provider of secure transportation and cash management services; Brink’s Home Security, one of the largest and most successful residential alarm companies in North America; and BAX Global, an industry leader in freight transportation and global supply chain management solutions. “

Get Brink's alerts:

A number of other equities research analysts have also recently issued reports on the stock. Buckingham Research initiated coverage on shares of Brink’s in a research report on Monday, March 26th. They set a “buy” rating and a $100.00 target price for the company. ValuEngine upgraded shares of Brink’s from a “hold” rating to a “buy” rating in a research report on Friday, April 6th. Finally, TheStreet upgraded shares of Brink’s from a “c+” rating to a “b-” rating in a research report on Tuesday, June 12th. One investment analyst has rated the stock with a sell rating and six have assigned a buy rating to the stock. The company presently has an average rating of “Buy” and an average price target of $96.80.

Shares of Brink’s traded up $0.05, reaching $80.30, during mid-day trading on Friday, Marketbeat.com reports. 239,668 shares of the stock were exchanged, compared to its average volume of 467,375. The stock has a market capitalization of $4.12 billion, a P/E ratio of 26.50, a price-to-earnings-growth ratio of 1.10 and a beta of 1.78. The company has a quick ratio of 1.77, a current ratio of 1.77 and a debt-to-equity ratio of 3.10. Brink’s has a fifty-two week low of $67.57 and a fifty-two week high of $88.10.

Brink’s (NYSE:BCO) last announced its earnings results on Wednesday, April 25th. The business services provider reported $0.65 earnings per share (EPS) for the quarter, topping analysts’ consensus estimates of $0.63 by $0.02. The business had revenue of $853.00 million during the quarter, compared to analysts’ expectations of $802.83 million. Brink’s had a net margin of 0.12% and a return on equity of 39.12%. The firm’s revenue for the quarter was up 8.2% on a year-over-year basis. During the same quarter last year, the company posted $0.57 EPS. equities analysts anticipate that Brink’s will post 3.75 earnings per share for the current year.

In other Brink’s news, SVP Mcalister C. Marshall II sold 18,163 shares of the firm’s stock in a transaction dated Tuesday, June 12th. The shares were sold at an average price of $79.76, for a total value of $1,448,680.88. The transaction was disclosed in a legal filing with the Securities & Exchange Commission, which is accessible through this hyperlink. Also, insider Thomas Colan sold 9,197 shares of the firm’s stock in a transaction dated Friday, June 1st. The shares were sold at an average price of $79.00, for a total transaction of $726,563.00. The disclosure for this sale can be found here. Insiders sold a total of 33,280 shares of company stock valued at $2,641,009 in the last 90 days. Corporate insiders own 2.48% of the company’s stock.

A number of institutional investors and hedge funds have recently bought and sold shares of the business. Mount Yale Investment Advisors LLC bought a new position in shares of Brink’s in the 1st quarter valued at about $132,000. Fortaleza Asset Management Inc. bought a new position in shares of Brink’s in the 2nd quarter valued at about $192,000. World Asset Management Inc bought a new position in shares of Brink’s in the 2nd quarter valued at about $200,000. Silvant Capital Management LLC bought a new position in shares of Brink’s in the 1st quarter valued at about $190,000. Finally, Hilltop Holdings Inc. bought a new position in shares of Brink’s in the 1st quarter valued at about $220,000. Hedge funds and other institutional investors own 90.73% of the company’s stock.

Brink’s Company Profile

The Brink's Company provides secure transportation, cash management, and other security-related services worldwide. The company offers cash-in-transit services, including armored vehicle transportation of valuables; automated teller machine (ATM) services, such as cash replenishment, replenishment forecasting, cash optimization, ATM remote monitoring, service call dispatching, transaction processing, installation, and first and second line maintenance; and network infrastructure services.

Further Reading: Stock Ratings and Recommendations: Understanding Analyst Upgrades and Downgrades

Get a free copy of the Zacks research report on Brink’s (BCO)

For more information about research offerings from Zacks Investment Research, visit Zacks.com

Analyst Recommendations for Brink`s (NYSE:BCO)

Thursday, July 19, 2018

Hot Cheap Stocks To Watch For 2019

tags:PH,EMR,WEN,RCII,SIRI, First, it conquered India. Now, it wants to win over Europe.

Chinese smartphone maker Xiaomi is making an aggressive play for European markets like France, Italy and Spain. The expansion comes ahead of the company's highly anticipated IPO, which is expected to raise billions of dollars this summer.

Xiaomi is best known for selling cheap, high performance smartphones. The bulk of its sales �� more than 70% �� are in China. But it has made inroads in other Asian countries, recently overtaking global leader Samsung to become the top smartphone seller in India.

Now, the Chinese company is looking to repeat that success in the more mature markets of Europe, and it's off to a strong start.

Xiaomi is currently the fourth largest smartphone company in Europe, behind Samsung (SSNLF), Apple (AAPL) and Chinese rival Huawei, according to research firms IDC and Canalys. It's competing strongly in Spain, Greece and Russia.

Impressive growth

Francisco Jeronimo, a London-based analyst with IDC, said the buzz surrounding Xiaomi in Europe reminds him of the early success of the iPhone.

Hot Cheap Stocks To Watch For 2019: S&P Smallcap 600(PH)

Advisors' Opinion:
  • [By Shane Hupp]

    ClariVest Asset Management LLC reduced its stake in shares of Parker Hannifin (NYSE:PH) by 3.0% during the 1st quarter, according to its most recent filing with the SEC. The firm owned 122,268 shares of the industrial products company’s stock after selling 3,773 shares during the period. ClariVest Asset Management LLC owned approximately 0.09% of Parker Hannifin worth $20,913,000 at the end of the most recent quarter.

  • [By Ethan Ryder]

    Get a free copy of the Zacks research report on Parker-Hannifin (PH)

    For more information about research offerings from Zacks Investment Research, visit Zacks.com

  • [By Shane Hupp]

    Barings LLC decreased its holdings in Parker Hannifin (NYSE:PH) by 36.4% in the first quarter, HoldingsChannel reports. The firm owned 26,064 shares of the industrial products company’s stock after selling 14,937 shares during the period. Barings LLC’s holdings in Parker Hannifin were worth $4,458,000 as of its most recent SEC filing.

  • [By Neha Chamaria]

    In terms of dividend growth, only four of the above stocks -- 3M, Colgate-Palmolive, Coca-Cola, and Procter & Gamble -- feature among the 10 fastest dividend-growth kings. In other words, there are six other stocks from the dividend kings list that have grown their dividends at a faster pace than most stocks in the above table in the past decade, some even at double-digits.��

    Six top dividend kings by dividend growth Dividend King 10-Year Dividend CAGR Current Dividend Yield Payout Ratio (TTM) Lowe's Companies� 18.5% 2% 34.5% Hormel Foods� 16.3% 2.1% 39.2% Parker-Hannifin Corp�(NYSE:PH) 14% 1.7% 35.2% Nordson Corporation� 12.2% 0.9% 13.3% Dover Corp (NYSE:DOV) 9% 2% 37.4% American States Water�(NYSE:AWR) 7.6% 1.9% 54.8%

    TTM: Trailing 12 months. Data sources: YCharts and Yahoo! Finance. Table by author.

  • [By Logan Wallace]

    Ardevora Asset Management LLP reduced its stake in shares of Parker Hannifin (NYSE:PH) by 0.5% in the first quarter, HoldingsChannel.com reports. The fund owned 154,400 shares of the industrial products company’s stock after selling 800 shares during the quarter. Ardevora Asset Management LLP’s holdings in Parker Hannifin were worth $26,407,000 as of its most recent filing with the Securities & Exchange Commission.

  • [By Ethan Ryder]

    Get a free copy of the Zacks research report on Parker Hannifin (PH)

    For more information about research offerings from Zacks Investment Research, visit Zacks.com

Hot Cheap Stocks To Watch For 2019: Emerson Electric Company(EMR)

Advisors' Opinion:
  • [By Lisa Levin]

    Analysts at Berenberg upgraded Emerson Electric Co. (NYSE: EMR) from Sell to Hold.

    Emerson Electric shares fell 0.43 percent to close at $69.90 on Monday.

  • [By Max Byerly]

    Flippin Bruce & Porter Inc. decreased its holdings in Emerson Electric (NYSE:EMR) by 33.6% in the first quarter, according to its most recent Form 13F filing with the Securities & Exchange Commission. The firm owned 66,251 shares of the industrial products company’s stock after selling 33,574 shares during the quarter. Flippin Bruce & Porter Inc.’s holdings in Emerson Electric were worth $4,525,000 as of its most recent filing with the Securities & Exchange Commission.

  • [By Benzinga News Desk]

    Former President George H.W. Bush has been hospitalized in Houston with an infection, just after attending the funeral of his wife, Barbara, a spokesman said Monday: Link

    ECONOMIC DATA Redbook Reports US Retail Sales During First 2 Weeks Of Apr. Up 0.3% MoM, Up 2.8% YoY USA S&P/CaseShiller House Price Index (MoM) for Feb Up 0.7% MoM New home sales report for March will be released at 10:00 a.m. ET. The Conference Board’s consumer sentiment index for April is schedule for release at 10:00 a.m. ET. The Richmond Fed manufacturing index for April will be released at 10:00 a.m. ET. The Treasury is set to auction 4-and 52-week bills at 11:30 a.m. ET. The Treasury will auction 2-year notes at 1:00 p.m. ET. ANALYST RATINGS Leerink upgraded Cardinal Health (NYSE: CAH) from Market Perform to Outperform Berenberg upgraded Emerson Electric (NYSE: EMR) from Sell to Hold Mizuho downgraded Skyworks (NASDAQ: SWKS) from Buy to Neutral BMO downgraded Texas Roadhouse (NASDAQ: TXRH) from Outperform to Market Perform

    This is a tool used by the Benzinga News Desk each trading day — it's a look at everything happening in the market, in five minutes. To get the full version of this note every morning, click here.

Hot Cheap Stocks To Watch For 2019: Wendy's/Arby's Group Inc.(WEN)

Advisors' Opinion:
  • [By Lisa Levin]


    Companies Reporting After The Bell Marriott International, Inc. (NASDAQ: MAR) is projected to post quarterly earnings at $1.22 per share on revenue of $5.72 billion. Electronic Arts Inc. (NASDAQ: EA) is estimated to post quarterly earnings at $1.04 per share on revenue of $5.68 billion. The Walt Disney Company (NYSE: DIS) is projected to post quarterly earnings at $1.68 per share on revenue of $14.05 billion. Papa John's International, Inc. (NASDAQ: PZZA) is expected to post quarterly earnings at $0.62 per share on revenue of $441.73 million. Jazz Pharmaceuticals plc (NASDAQ: JAZZ) is projected to post quarterly earnings at $2.77 per share on revenue of $434.87 million. Sun Life Financial Inc. (NYSE: SLF) is estimated to post quarterly earnings at $0.89 per share on revenue of $6.38 billion. LATAM Airlines Group S.A. (NYSE: LTM) is expected to post quarterly earnings at $0.16 per share on revenue of $2.70 billion. Liberty Global plc (NASDAQ: LBTYA) is projected to post quarterly earnings at $0.02 per share on revenue of $4.05 billion. TripAdvisor, Inc. (NASDAQ: TRIP) is expected to post quarterly earnings at $0.16 per share on revenue of $362.11 million. The Wendy's Company (NASDAQ: WEN) is projected to post quarterly earnings at $0.1 per share on revenue of $379.98 million. A-Mark Precious Metals, Inc. (NASDAQ: AMRK) is expected to post quarterly earnings at $0.06 per share on revenue of $1.69 billion. Monster Beverage Corporation (NASDAQ: MNST) is estimated to post quarterly earnings at $0.4 per share on revenue of $849.38 million. Convergys Corporation (NYSE: CVG) is expected to post quarterly earnings at $0.4 per share on revenue of $670.10 million. ScanSource, Inc. (NASDAQ: SCSC) is projected to post quarterly earnings at $0.7 per share on revenue of $875.91 million. KAR Auction Services, Inc. (NYSE: KAR) is expected to post quarterly earnings at $0.76 per share on revenue of $923.13
  • [By Ethan Ryder]

    A.R.T. Advisors LLC lowered its stake in Wendys Co (NASDAQ:WEN) by 19.3% during the 1st quarter, according to the company in its most recent disclosure with the Securities & Exchange Commission. The institutional investor owned 150,664 shares of the restaurant operator’s stock after selling 36,036 shares during the period. A.R.T. Advisors LLC owned 0.06% of Wendys worth $2,644,000 at the end of the most recent reporting period.

  • [By Leo Sun]

    However, the fast casual market became increasingly crowded with rival chains like Panera Bread and Chipotle, and Zoe's got squeezed between traditional dine-in restaurants like Darden's Olive Garden and evolving fast food players like Wendy's (NASDAQ:WEN) and McDonald's (NYSE:MCD).

Hot Cheap Stocks To Watch For 2019: Rent-A-Center Inc.(RCII)

Advisors' Opinion:
  • [By Chris Lange]

    Rent-A-Center Inc. (NASDAQ: RCII) shares made an incredible gain on Monday after the company announced that it would be taken private by Vintage Rodeo Parent, an affiliate of Vintage Capital Management.

  • [By Ethan Ryder]

    Get a free copy of the Zacks research report on Rent-A-Center (RCII)

    For more information about research offerings from Zacks Investment Research, visit Zacks.com

  • [By Timothy Green]

    Shares of Rent-A-Center Inc. (NASDAQ:RCII) surged on Tuesday after Vintage Capital Management increased its offer to acquire the company. Rent-A-Center disclosed on Monday that it had received an offer from one of the companies involved in its strategic review process soon after that process was ended. Rent-A-Center stock was up about 15% at 12:35 p.m. EDT.

  • [By Timothy Green]

    Shares of rent-to-own retailer Rent-A-Center Inc. (NASDAQ:RCII) soared on Monday after the company agreed to be acquired for $15 per share. This comes less than a week after Rent-A-Center received a lower buyout offer following the completion of its strategic review. The stock was up about 22.2% at 11:30 a.m. EDT.

  • [By ]

    Engaged Capital maintained large positions in Rent-A-Center (RCII) , TiVo (TIVO) , Hain Celestial (HAIN) , SunOpta and Jamba Inc. (JMBA) , all companies that have either previously been targeted by Welling or currently are in his cross-hairs.

Hot Cheap Stocks To Watch For 2019: Sirius XM Radio Inc.(SIRI)

Advisors' Opinion:
  • [By Paul Ausick]

    Sirius XM
    The more than 206.74 million Sirius XM Holdings Inc. (NASDAQ: SIRI) shares that were short after the last two weeks of this month amounted to just 0.1% or so more than on the previous settlement date. This was the third-lowest level of short interest in the past year, and it totaled 15.8% of the available float. The average daily volume has shrunk in seven of the past eight periods, and the number of days to cover inched up to nearly 13. Sirius’ stock price was $7.22 at the trading day’s close yesterday. Its 52-week low is $5.09 and the 52-week high is $7.33, a multiyear high posted this week.

  • [By Rick Munarriz]

    Sirius XM Holdings (NASDAQ:SIRI)�is gearing up for a big earnings announcement this week. The satellite radio provider reports first-quarter results before Wednesday's market open, and a lot is riding on its financial performance. Sirius XM has been one of the market's biggest winners since bottoming out at $0.05 -- yes, a nickel -- in 2009. The stock is now a 127-bagger, and it hit a new 12-year high just last month.

  • [By Jon C. Ogg]

    Sirius XM Holdings Inc. (NASDAQ: SIRI) has just received its most bullish sell-side analyst rating�on Wall Street. Credit Suisse’s Brian Russo has raised the bar on Sirius XM with an Outperform rating with an $8.50 price target.

  • [By VantagePoint]

    Siriux XM Holdings Inc. (NASDAQ: SIRI) began trading higher on April 19 following a bullish crossover, but the real uptrend didn't begin until May 3. This is an example of how trends can sometimes take several days to take shape, as the upside wasn't immediately apparent. Nonetheless, the stock is trading at its highest levels since 2005. 

  • [By ]

    Berkshire's biggest winners in the stock market so far this year are MasterCard Inc. (MA) , up 23%; Sirius XM Holdings Inc. (SIRI) , up 18%; Phillips 66 (PSX) , up 14%; Visa Inc. (V) , up 11%; and Moody's Corp. (MCO) , also up 11%, according to FactSet.

  • [By ]

    Remember, Apple (AAPL) had run because its service-revenue stream made the tech giant part of an elite group of companies. It joined Costco (COST) , Netflix (NFLX) , and SiriusXM (SIRI) , Spotify (SPOT) and Amazon (AMZN) (home of Amazon Prime) as companies that charge you recurring fees that you don't seem to notice or care about. So, Apple's stock no longer represents the tug to the group, and each company has to develop a separate power base away from Cupertino.

Monday, July 16, 2018

Entravision Communication (EVC) Given Average Rating of “Hold” by Brokerages

Shares of Entravision Communication (NYSE:EVC) have earned an average rating of “Hold” from the seven brokerages that are presently covering the firm, Marketbeat reports. Two research analysts have rated the stock with a sell recommendation, two have given a hold recommendation and two have given a buy recommendation to the company. The average 12-month target price among analysts that have issued ratings on the stock in the last year is $7.00.

A number of brokerages have commented on EVC. ValuEngine downgraded shares of Entravision Communication from a “sell” rating to a “strong sell” rating in a report on Friday, June 22nd. Zacks Investment Research upgraded shares of Entravision Communication from a “sell” rating to a “hold” rating in a report on Wednesday, June 27th. Gabelli reiterated a “buy” rating on shares of Entravision Communication in a report on Wednesday, June 20th. Noble Financial upgraded shares of Entravision Communication from a “hold” rating to a “buy” rating in a report on Tuesday, June 12th. Finally, TheStreet downgraded shares of Entravision Communication from a “b-” rating to a “c” rating in a report on Friday, March 23rd.

Get Entravision Communication alerts:

Several hedge funds have recently modified their holdings of EVC. BlackRock Inc. grew its stake in shares of Entravision Communication by 117.4% during the fourth quarter. BlackRock Inc. now owns 9,076,176 shares of the company’s stock worth $64,894,000 after acquiring an additional 4,900,809 shares during the last quarter. Ceredex Value Advisors LLC purchased a new stake in shares of Entravision Communication during the first quarter worth about $15,807,000. Millennium Management LLC grew its stake in shares of Entravision Communication by 373.3% during the fourth quarter. Millennium Management LLC now owns 1,972,143 shares of the company’s stock worth $14,101,000 after acquiring an additional 1,555,499 shares during the last quarter. Two Sigma Investments LP grew its stake in shares of Entravision Communication by 399.2% during the fourth quarter. Two Sigma Investments LP now owns 959,644 shares of the company’s stock worth $6,861,000 after acquiring an additional 767,414 shares during the last quarter. Finally, Renaissance Technologies LLC grew its stake in shares of Entravision Communication by 39.0% during the fourth quarter. Renaissance Technologies LLC now owns 2,585,752 shares of the company’s stock worth $18,488,000 after acquiring an additional 725,252 shares during the last quarter. Institutional investors and hedge funds own 63.71% of the company’s stock.

Entravision Communication stock traded down $0.05 during trading hours on Thursday, reaching $5.00. The stock had a trading volume of 304,600 shares, compared to its average volume of 529,809. The company has a market capitalization of $439.67 million, a PE ratio of 2.92 and a beta of 1.43. The company has a debt-to-equity ratio of 0.86, a quick ratio of 6.50 and a current ratio of 6.50. Entravision Communication has a 52 week low of $3.90 and a 52 week high of $7.90.

The company also recently announced a quarterly dividend, which was paid on Friday, June 29th. Shareholders of record on Thursday, June 14th were issued a $0.05 dividend. The ex-dividend date was Wednesday, June 13th. This represents a $0.20 dividend on an annualized basis and a yield of 4.00%. Entravision Communication’s dividend payout ratio is presently 11.56%.

About Entravision Communication

Entravision Communications Corporation operates as a media company that reaches and engages Hispanics across media channels and advertising platforms primarily in the United States, Spain, Mexico, Argentina, and other Latin America countries. The company operates through three segments: Television Broadcasting, Radio Broadcasting, and Digital Media.

Thursday, July 12, 2018

MCX Q1 PAT seen up 9.3% QoQ to Rs. 37 cr: HDFC Securities


HDFC Securities has come out with its first quarter (April-June�� 18) earnings estimates for the Technology sector. The brokerage house expects MCX to report net profit at Rs. 37 crore up 9.3% quarter-on-quarter (up 41.9% year-on-year).


Net Sales are expected to increase by 5.2 percent Q-o-Q (up 25.4 percent Y-o-Y) to Rs. 74 crore, according to HDFC Securities.


Earnings before interest, tax, depreciation and amortisation (EBITDA) are likely to rise by 12.7 percent Q-o-Q (up 101.1 percent Y-o-Y) to Rs. 26 crore.


Disclaimer: The views and investment tips expressed by investment experts on moneycontrol.com are their own, and not that of the website or its management. Moneycontrol.com advises users to check with certified experts before taking any investment decisions.

Read More First Published on Jul 12, 2018 06:07 pm

Wednesday, July 11, 2018

What This Critical Change Means for the Price of Silver

Peter KrauthPeter Krauth

Last week, I asked if the price of silver's decline since the Fed rate hike had been enough. I believe it has, and it's a turning point for silver…

At the time, I suspected we were very close.� After all, the metal had lost as much as 7.5% in just two and a half weeks.� It seemed like the bottom should be near.

In the silver futures market, that bottom came on July 2.� In the spot market, it came a few hours later, overnight into July 3.� By then, it appears, anyone wanting out had sold.

silver

The rally in the U.S. Dollar Index (DXY) peaked a few days earlier at 95.4.� But by last Thursday (July 5), when the Fed's June minutes were released, the greenback was already retreating.

The minutes revealed some Fed officials were concerned that raising rates too aggressively could cause the yield curve to invert.

And we know that sort of setup consistently precedes a recession.

Many FOMC members were also worried trade wars could stall economic growth.� With that in mind, the odds of two more rate hikes in 2018 were further in doubt.� Less hikes mean a less attractive dollar relative to other currencies, and so the dollar began selling off.

Massive Upgrade Could Send Bitcoin to $100,000: Click here to learn about the opportunity that could deliver a million-dollar payday to investors who act now.

So now, with the potential combination of a weakening dollar, a sentiment shift towards positive in silver, and seasonal tailwind, we could see the grey metal rally from here.

I'll show you my exact silver price prediction too, but I want to take a deeper dive into last week's silver prices first…

Silver Prices Finally Turned Around

Silver prices reached a bottom around 1 a.m. on Tuesday (July 3).

The DXY was still up near 94.9, but then rapidly sold down to trade near 94.6 most of that day.� That weakness helped silver bottom and rally, opening at $15.93 then finally closing back at $16.

From there, silver would peak on Wednesday (July 4) at $16.13 around 3 a.m. before backing off to close at $16.06 on that shortened trading day. On Thursday before the open, silver backed down to $15.92 in anticipation of the Fed minutes but then rallied back even as the dollar gained.

The DXY hasn't managed to best its highs of 94.5 of that day, while silver ended trading sideways around the $16 level. Take a look…

Here's a look at the DXY for the past five trading days.

Silver

Then by early Monday (July 9), with the DXY initially selling off further to 93.75, silver prices managed to rally to $16.20 before dialing back to $16.10 as the DXY bounced back to 94 by 11 a.m.

But the dollar index would gain still more strength, peaking near 94.20, then settling closer to 94.10. The price of silver backed off and hovered near $16.08, where it finally closed.

But now that the price of silver has turned around, here's where I predict silver prices heading next…

My Latest Silver Price Forecast

Join the conversation. Click here to jump to comments…

Peter KrauthPeter Krauth

About the Author

Browse Peter's articles | View Peter's research services

Peter Krauth is the Resource Specialist for Money Map Press and has contributed some of the most popular and highly regarded investing articles on Money Morning. Peter is headquartered in resource-rich Canada, but he travels around the world to dig up the very best profit opportunity, whether it's in gold, silver, oil, coal, or even potash.

… Read full bio

Tuesday, July 10, 2018

Galaxy Resources Sal De Vida Project Is About To Be De-Risked After A Huge Cash Sale To POSCO

For a background on Galaxy Resources ("Galaxy") investors can read my previous articles:

June 22, 2016 - Galaxy Resources - An Excellent Way To Invest Into The Lithium Miners. August 22, 2016 - Galaxy Resources Is An Outstanding Buy After Its Recent 20% Fall. October 3, 2017 - Will Galaxy Resources Be Next With Some Good News?

Note: Since the above articles Galaxy did a 5:1 share consolidation. Therefore the stock prices quoted in the above articles need to be multiplied by 5x to compare to the current stock price.

Galaxy Resources [ASX:GXY] (OTCPK:GALXF) - Price = AUD 3.42

Galaxy Resources is an Australian pure play lithium miner with 3 lithium projects globally.

Galaxy Resources 5 year price graph
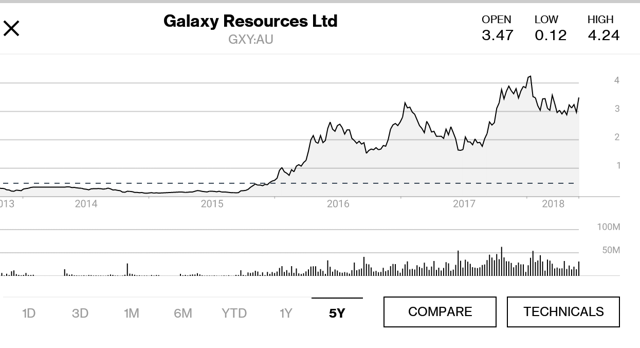
Source: Bloomberg

Galaxy Resources three lithium projects (all 100% owned) Mt Cattlin Australia (lithium spodumene producer) Sal De Vida Argentina (lithium brine project) James Bay Canada (lithium spodumene project)

Note: From here on I will focus on the Sal De Vida project in Argentina.

The Sal De Vida [SDV] project

Sal De Vida - location map
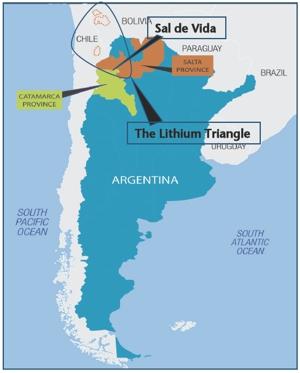
Source

Galaxy Resources Sal De Vida resources

Prior to the sale to POSCO Galaxy had announced a total Lithium Carbonate Equivalent [LCE] resource at Sal De Vida of 7.23m tonnes contained lithium (at a lithium grade of 780mg/L), or 1.14 million tonnes of contained LCE reserves.

After the sale of the northern tenements to POSCO the total resource estimate falls to 4.09 million tonnes LCE as Galaxy retains the southern tenements. The reserves estimate remains unchanged. See below.

The POSCO deal

On May 29 Galaxy Resources announced, "Galaxy agrees to sell northern tenement package at Sal De Vida for US$280 million to POSCO. Galaxy retains 100% of the tenements in the southern area of Salar del Hombre Muerto in the Catamarca Province included in the recently announced updated feasibility study for the development of Sal de Vida. The southern tenements contain an estimated 4.09million tonnes LCE of JORC compliant measured and indicated resource and 100% of the current 1.14 million tonnes LCE of JORC compliant reserves."

Note: The Sal De Vida salar is part of the Salar del Hombre Muerto.

SDV tenements map - Blue sold to POSCO, and red retained by Galaxy
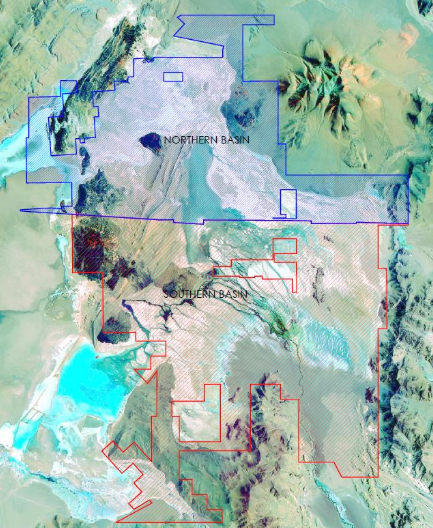
Source

The key point to note here is that Galaxy Resources retains a large enough section of Sal De Vida (1.14 million tonnes LCE) that they can still produce about 25ktpa LCE over a 40 year mine life, and the Feasibility Study [FS] conclusions (post tax NPV8% of US$1.48 billion) are not impacted at all. Galaxy gets an enormous cash boost that can greatly help fund their SDV development with no need for a project partner.

Infrastructure and access

Access and infrastructure are good as FMC Corp. (FMC) has been producing in the salar since 1997.

Management

Martin Rowley - Independent Non Executive Chairman

Mr Rowley was a co-founder of TSX and LSE-listed First Quantum Minerals Ltd and is currently that company��s Executive Director, Business Development. First Quantum is one of the world's largest copper production companies and the owner of the Ravensthorpe nickel project in Western Australia with a market capitalisation of in excess of A$10 billion. He was previously non-executive Chairman and director of Lithium One Inc., which was acquired by Galaxy by way of a Plan of Arrangement in July 2012. He is also non-executive Chairman and a director of Forsys Metals Corp, a TSX-listed company in the uranium sector.

Anthony Tse - Managing Director

Mr Tse has 20 years of corporate experience in numerous high-growth industries such as technology, internet/mobile, media & entertainment, and resource & commodities �� primarily in senior management, capital markets and M&A roles across Greater China and Asia Pacific in general. His previous management roles include various positions in News Corporation's STAR TV, the Deputy General Manager of TOM Online, Director of Corporate Development at Hutchison Whampoa's TOM Group, President of China Entertainment Television (a joint venture between TOM and Time Warner), and CEO of CSN Corp. He is a Fellow of the Hong Kong Institute of Directors (HKIoD) and a member of the Hong Kong Mining Investment Professionals Association (HKMIPA).

Brian Talbot B.Sc Eng. (Hons) - Chief Operations Officer

Mr Talbot has over 25 years�� experience in mining and minerals processing operations and holds a bachelor��s degree in chemical engineering with Honours. Mr Talbot was previously Galaxy��s General Manager where he has managed the Mt Cattlin mine site increasing production to above plan design. Prior to joining Galaxy he was at Bikita Minerals, a lithium mine in Zimbabwe where he achieved increased product yield and capacity. Mr Talbot has also held the positions of mining company director, general manager and metallurgist at various mine operations in Egypt and South Africa with diverse experience in designing, planning and managing profitable mining operations.

You can read more here.

Largest Shareholders
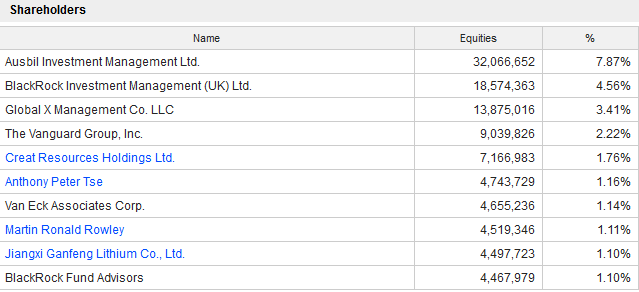
Source

Note: Insider ownership should increase as options are converted to shares if performance targets are met. A strong level of institutional ownership.

Sal De Vida PFS

On May 15, 2018 Galaxy reported: "Sal de Vida - Updated Feasibility Study." Highlights include:

"Results from the updated feasibility study for the Sal de Vida Project validate a technically superior, highly profitable, long life (40 years) and low-cost lithium and potash project. Post-tax Net Present Value ("NPV") of US$1.48 billion at an 8% discount rate (real). Post-tax Internal Rate of Return ("IRR") of 26.9%, with post-tax payback period of approximately 3 years from first production. Capital cost estimate of US$474million, including US$31million for an optional potash production circuit. Operating costs at full production of US$3,144 per tonne of lithium carbonate after potash credits. Average annual revenues of US$360 million and EBITDA of US$270 million. JORC-compliant reserve estimate of 1.1 million tonnes of recoverable lithium carbonate equivalent ("LCE"), supports a long initial project life with 25ktpa of lithium carbonate and 94ktpa of potash production respectively." Valuation

Galaxy Resources has no debt and cash as at 31 December 2017 of AUD 59.7m. Current market cap is AUD 1.39b.

My recently updated price target (assuming the US$ 280m POSCO deal goes through) for end 2021 is AUD 5.90 or ~1.7x higher, based on Mt Catlin (250ktpa spodumene) and Sal de Vida (15ktpa LCE) being in production. Assumes a cost of production of USD 3,144/t LCE for brine (USD 320/t spodumene) and a selling price of USD 12,000/t LCE for brine (USD 900/t spodumene). Assumes a CapEx of USD 474m to get SDV to production.

Note: My model suggests SDV can be fully funded by Galaxy from retained earnings and the POSCO deal monies.

By 2023/2024 my price target increases to AUD 11.83 or ~3.5x higher, based on Mt Catlin (250ktpa spodumene), Sal de Vida (25ktpa LCE), and James Bay (250ktpa spodumene) all being in production. Assumes the same costs and selling prices as above. Galaxy would then be an AUD 4.6b market cap lithium pure play global leader.

Current analyst consensus estimates for Galaxy Resources is AUD 4.15 or 17% upside. I would assume the analysts have not yet factored in the POSCO deal, as the deal has not yet finalized. Once it finalizes I would expect a significant target increase closer to AUD 5.00.

Catalysts Q3, 2018 - POSCO deal due to complete. Q3, 2018 - The FMC lithium IPO should give a boost to Galaxy's SDV project valuation being located nearby. 2018 - Mt Cattlin resource upgrade. James Bay Feasibility Study. 2018/19 - Announcements to commence construction of Sal De Vida. 2020/21 - Sal De Vida production to begin. Competitors For coverage of the lithium miner competitors investors can view my articles "Lithium Miners News For The Month Of May 2018", and "Lithium Junior Miner News For The Month Of May 2018." Risks Lithium prices falling. My model does forecast a possible mild lithium oversupply in 2019/2020 as does Benchmark Minerals recent analysis. The electric vehicle [EV] boom and energy storage boom may not continue. Technology change may replace lithium in the battery. Very unlikely The usual mining risks - Exploration risks, funding risks, permitting risks, production risks. As discussed funding risk at SDV will shortly be gone. Management and currency risks. Sovereign risk is medium in Argentina and low in Australia and Canada. Stock market risks - Dilution, lack of liquidity (best to buy on local exchange), market sentiment.

Investors can view the company presentation here.

Conclusion

Galaxy Resources has had a good run the past 3-4 years. Assuming the recent POSCO deal goes through the stock will re-rate significantly higher. In fact, my modeling shows Galaxy will no longer need any funding whatsoever to develop Sal De Vida, nor will they need a project partner. This is highly significant in several ways. Firstly it de-risks the Sal De Vida project from a funding perspective, and also allows Galaxy to retain 100% ownership should they choose. Secondly the USD 280m of cash massively strengthens Galaxy's already strong balance sheet which de-risks the Company as a whole.

The magic of the POSCO deal for Galaxy and Galaxy shareholders is that the Sal De Vida project economics are not affected, SDV can still have a superb 40 year production life, and the Feasibility Study NPV of USD 1.48b is also completely unchanged. Clearly management at Galaxy has pulled another rabbit from their magical hat.

Given the deal is highly likely to go through investors have just a short window to get onboard before analysts upgrade their targets.

As usual all comments are welcome.

Trend Investing

Thanks for reading the article. If you want to go to the next level, sign up for Trend Investing, my Marketplace service. I share my best investing ideas and latest articles on the latest trends. You will also get access to exclusive CEO interviews and chat room access to me, and to other sophisticated investors. You can benefit from the hundreds of hours of work I've done to analyze the best opportunities in emerging industries, especially the electric vehicle and EV metals sector. You can learn more by reading "The Trend Investing Difference", "Recent Subscriber Feedback On Trend Investing", or sign up here.

My latest related Trend Investing articles are:

An Update On Pilbara Minerals Investing Well - July 2018 An Update On Cobalt Blue

Disclosure: I am/we are long GALAXY RESOURCES [ASX:GXY].

I wrote this article myself, and it expresses my own opinions. I am not receiving compensation for it (other than from Seeking Alpha). I have no business relationship with any company whose stock is mentioned in this article.

Additional disclosure: The information in this article is general in nature and should not be relied upon as personal financial advice.

Editor's Note: This article discusses one or more securities that do not trade on a major U.S. exchange. Please be aware of the risks associated with these stocks.

Monday, July 9, 2018

Best Energy Stocks To Buy Right Now

tags:MIC,IO,WPX,XCO, IN THE NEWS

Walt Disney Co (NYSE: DIS) cancelled ABC’s “Roseanne” reboot Tuesday after star Roseanne Barr tweeted a racist comment about an adviser to former President Barack Obama: Link

U.S. stocks were hit hard Tuesday, partly due to political turmoil in Italy as the country's President Sergio Mattarella rejected an economic ministry nominee who holds a "euroskeptic" stance: Link

The White House’s surprise decision to move forward with tariffs and other sanctions against China threatens to derail trade talks scheduled for this weekend, according to people with knowledge of the matter on both sides: Link $

America’s food giants are shedding a generation of CEOs at a remarkable rate, the culmination of years of bleak sales in an industry that until recently, had gone unshaken for half a century: Link $

The number of electric vehicles on roads worldwide rose to a record high of 3.1 million in 2017, but more research, policies and incentives are needed to drive further uptake, the International Energy Agency said: Link

Wall Street’s long campaign to chip away at the toughest trading restriction imposed on banks after financial crisis is finally paying off: Link $

Best Energy Stocks To Buy Right Now: Macquarie Infrastructure Company(MIC)

Advisors' Opinion:
  • [By Joseph Griffin]

    Macquarie Infrastructure (NYSE: MIC) and Aegean Marine Petroleum Network (NYSE:ANW) are both multi-sector conglomerates companies, but which is the better business? We will contrast the two businesses based on the strength of their institutional ownership, risk, earnings, valuation, profitability, analyst recommendations and dividends.

  • [By Ethan Ryder]

    These are some of the headlines that may have impacted Accern Sentiment’s scoring:

    Get Macquarie Infrastructure alerts: EQUITY ALERT: Levi & Korsinsky, LLP Reminds Shareholders of Macquarie Infrastructure Corporation of a Class Action Lawsuit and a Lead Plaintiff Deadline of June 25, 2018 �� MIC (finance.yahoo.com) Macquarie Infrastructure (MIC) Director Acquires $7,136,892.00 in Stock (americanbankingnews.com) Rohatyn Group acquires JP Morgan’s Asia infrastructure portfolio (dealstreetasia.com) Form 8-K Macquarie Infrastructure For: May 16 (streetinsider.com) Macquarie Infrastructure Partners amasses over $3.84 bln for fourth fund (pehub.com)

    Several brokerages have recently commented on MIC. Zacks Investment Research raised Macquarie Infrastructure from a “sell” rating to a “hold” rating in a research note on Tuesday, January 30th. ValuEngine lowered Macquarie Infrastructure from a “hold” rating to a “sell” rating in a research note on Thursday, March 1st. Royal Bank of Canada decreased their price target on Macquarie Infrastructure to $55.00 and set an “outperform” rating on the stock in a research note on Friday, February 23rd. JPMorgan Chase & Co. lowered Macquarie Infrastructure from an “overweight” rating to a “neutral” rating in a research note on Thursday, February 22nd. Finally, SunTrust Banks lowered Macquarie Infrastructure from a “buy” rating to a “hold” rating in a research note on Thursday, February 22nd. Three investment analysts have rated the stock with a sell rating, five have given a hold rating and two have given a buy rating to the company. The stock has an average rating of “Hold” and an average price target of $57.00.

  • [By Joseph Griffin]

    Atria Investments LLC raised its holdings in Macquarie Infrastructure (NYSE:MIC) by 59.3% in the first quarter, according to the company in its most recent disclosure with the SEC. The firm owned 8,737 shares of the conglomerate’s stock after acquiring an additional 3,251 shares during the quarter. Atria Investments LLC’s holdings in Macquarie Infrastructure were worth $323,000 as of its most recent filing with the SEC.

Best Energy Stocks To Buy Right Now: Ion Geophysical Corporation(IO)

Advisors' Opinion:
  • [By Shane Hupp]

    Get a free copy of the Zacks research report on Ion Geophysical (IO)

    For more information about research offerings from Zacks Investment Research, visit Zacks.com

  • [By Joseph Griffin]

    Ion Geophysical (NYSE: IO) and Pembina Pipeline (NYSE:PBA) are both oils/energy companies, but which is the better stock? We will contrast the two companies based on the strength of their profitability, institutional ownership, valuation, earnings, dividends, analyst recommendations and risk.

  • [By Shane Hupp]

    Janney Montgomery Scott started coverage on shares of Ion Geophysical (NYSE:IO) in a research note issued to investors on Tuesday, MarketBeat Ratings reports. The brokerage issued a buy rating and a $35.00 target price on the oil and gas company’s stock.

Best Energy Stocks To Buy Right Now: WPX Energy, Inc.(WPX)

Advisors' Opinion:
  • [By Shane Hupp]

    US Capital Advisors initiated coverage on shares of WPX Energy (NYSE:WPX) in a research note issued to investors on Monday. The firm issued a buy rating on the oil and gas producer’s stock.

  • [By Joseph Griffin]

    WPX Energy (NYSE:WPX) had its price target lifted by Stifel Nicolaus from $27.00 to $28.00 in a research note issued to investors on Wednesday. They currently have a buy rating on the oil and gas producer’s stock.

  • [By Shane Hupp]

    Hodges Capital Management Inc. lowered its stake in shares of WPX Energy (NYSE:WPX) by 1.6% during the 1st quarter, according to the company in its most recent Form 13F filing with the Securities and Exchange Commission (SEC). The fund owned 1,047,818 shares of the oil and gas producer’s stock after selling 17,025 shares during the period. WPX Energy accounts for about 1.2% of Hodges Capital Management Inc.’s investment portfolio, making the stock its 23rd largest position. Hodges Capital Management Inc. owned about 0.26% of WPX Energy worth $15,487,000 as of its most recent filing with the Securities and Exchange Commission (SEC).

Best Energy Stocks To Buy Right Now: EXCO Resources NL(XCO)

Advisors' Opinion:
  • [By Joseph Griffin]

    Press coverage about EXCO Resources (NYSE:XCO) has been trending somewhat positive recently, Accern reports. The research firm rates the sentiment of media coverage by analyzing more than 20 million blog and news sources. Accern ranks coverage of publicly-traded companies on a scale of negative one to one, with scores closest to one being the most favorable. EXCO Resources earned a media sentiment score of 0.18 on Accern’s scale. Accern also gave news coverage about the oil and natural gas company an impact score of 45.0615500193326 out of 100, meaning that recent media coverage is somewhat unlikely to have an effect on the stock’s share price in the near term.

  • [By Max Byerly]

    X-Coin (CURRENCY:XCO) traded down 14.7% against the dollar during the 1 day period ending at 12:00 PM Eastern on June 27th. During the last week, X-Coin has traded 22.2% lower against the dollar. One X-Coin coin can currently be purchased for about $0.0079 or 0.00000130 BTC on popular cryptocurrency exchanges including Cryptopia and YoBit. X-Coin has a total market cap of $98,336.00 and approximately $1,753.00 worth of X-Coin was traded on exchanges in the last day.

  • [By Logan Wallace]

    X-Coin (CURRENCY:XCO) traded down 8.9% against the U.S. dollar during the 1 day period ending at 20:00 PM E.T. on May 28th. X-Coin has a total market cap of $76,806.00 and $235.00 worth of X-Coin was traded on exchanges in the last day. During the last week, X-Coin has traded 15.7% lower against the U.S. dollar. One X-Coin coin can currently be purchased for about $0.0062 or 0.00000087 BTC on cryptocurrency exchanges including Cryptopia and YoBit.

  • [By Shane Hupp]

    X-Coin (CURRENCY:XCO) traded down 1.3% against the dollar during the 24 hour period ending at 7:00 AM E.T. on July 1st. During the last week, X-Coin has traded up 37.4% against the dollar. One X-Coin coin can now be bought for $0.0088 or 0.00000137 BTC on major exchanges including Cryptopia and YoBit. X-Coin has a total market cap of $108,460.00 and approximately $881.00 worth of X-Coin was traded on exchanges in the last 24 hours.

Saturday, July 7, 2018

Head-To-Head Survey: Spok (SPOK) versus Mobil’nye Telesistemy PAO (MBT)

Spok (NASDAQ: SPOK) and Mobil’nye Telesistemy PAO (NYSE:MBT) are both computer and technology companies, but which is the better stock? We will contrast the two businesses based on the strength of their valuation, analyst recommendations, earnings, dividends, profitability, risk and institutional ownership.

Volatility & Risk

Get Spok alerts:

Spok has a beta of 0.56, meaning that its share price is 44% less volatile than the S&P 500. Comparatively, Mobil’nye Telesistemy PAO has a beta of 1.07, meaning that its share price is 7% more volatile than the S&P 500.

Profitability

This table compares Spok and Mobil’nye Telesistemy PAO’s net margins, return on equity and return on assets.

Net Margins Return on Equity Return on Assets
Spok -9.05% 2.84% 2.37%
Mobil’nye Telesistemy PAO 13.76% 45.69% 9.88%

Dividends

Spok pays an annual dividend of $0.50 per share and has a dividend yield of 3.2%. Mobil’nye Telesistemy PAO pays an annual dividend of $0.70 per share and has a dividend yield of 7.5%. Mobil’nye Telesistemy PAO pays out 71.4% of its earnings in the form of a dividend.

Analyst Recommendations

This is a breakdown of current ratings and recommmendations for Spok and Mobil’nye Telesistemy PAO, as provided by MarketBeat.com.

Sell Ratings Hold Ratings Buy Ratings Strong Buy Ratings Rating Score
Spok 0 0 0 0 N/A
Mobil’nye Telesistemy PAO 0 1 6 0 2.86

Mobil’nye Telesistemy PAO has a consensus target price of $10.75, suggesting a potential upside of 15.59%. Given Mobil’nye Telesistemy PAO’s higher possible upside, analysts clearly believe Mobil’nye Telesistemy PAO is more favorable than Spok.

Valuation & Earnings

This table compares Spok and Mobil’nye Telesistemy PAO’s top-line revenue, earnings per share (EPS) and valuation.

Gross Revenue Price/Sales Ratio Net Income Earnings Per Share Price/Earnings Ratio
Spok $171.18 million 1.79 -$15.30 million N/A N/A
Mobil’nye Telesistemy PAO $6.70 billion 1.38 $958.31 million $0.98 9.49

Mobil’nye Telesistemy PAO has higher revenue and earnings than Spok.

Institutional & Insider Ownership

83.0% of Spok shares are held by institutional investors. Comparatively, 32.3% of Mobil’nye Telesistemy PAO shares are held by institutional investors. 1.6% of Spok shares are held by company insiders. Comparatively, 1.0% of Mobil’nye Telesistemy PAO shares are held by company insiders. Strong institutional ownership is an indication that endowments, hedge funds and large money managers believe a company is poised for long-term growth.

Summary

Mobil’nye Telesistemy PAO beats Spok on 9 of the 14 factors compared between the two stocks.

Spok Company Profile

Spok Holdings, Inc., through its subsidiary, Spok, Inc., provides various communications solutions to healthcare, government, and other enterprises in the United States, Europe, Canada, Australia, Asia, and the Middle East. The company provides one-way messaging, including numeric messaging services, which enable subscribers to receive messages comprising numbers, such as phone numbers; and alphanumeric messages, including numbers and letters that enable subscribers to receive text messages. It also offers two-way messaging services that enable subscribers to send and receive messages to and from other wireless messaging devices, such as pagers, personal digital assistants, and personal computers; and voice mail, personalized greeting, message storage and retrieval, and equipment loss and/or maintenance protection to one-way and two-way messaging subscribers. In addition, the company develops, sells, and supports enterprise-wide systems to automate, centralize, and standardize mission critical communications for contact centers, clinical alerting and notification, mobile communications, and messaging, as well as for public safety notifications. Further, it sells devices to resellers who lease or resell them to their subscribers; ancillary services, such as voicemail and equipment loss or maintenance protection, as well as provides a suite of professional services. The company serves businesses, professionals, management personnel, medical personnel, field sales personnel and service forces, members of the construction industry and construction trades, real estate brokers and developers, sales and services organizations, specialty trade organizations, manufacturing organizations, and government agencies. The company was formerly known as USA Mobility, Inc. and changed its name to Spok Holdings, Inc. in July 2014. Spok Holdings, Inc. is headquartered in Springfield, Virginia.

Mobil’nye Telesistemy PAO Company Profile

Public Joint-Stock Company Mobile TeleSystems provides telecommunication services in Russia, Ukraine, Turkmenistan, and Armenia. The company operates through three segments: Russia Convergent, Moscow Fixed Line, and Ukraine. It offers voice and data transmission, Internet access, pay TV, and various value added services through wireless and fixed lines, as well as sells equipment, accessories, and handsets. The company also provides system integration services and IT solutions. Public Joint-Stock Company Mobile TeleSystems has a partnership agreement with Nokia for joint development and deployment of Nokia's new technological solutions, as well as to promote new digital products and services of Mobile TeleSystems Group. The company was founded in 1993 and is based in Moscow, Russia. Public Joint-Stock Company Mobile TeleSystems is a subsidiary of Sistema Finance S.A.

Friday, July 6, 2018

Somewhat Positive News Coverage Somewhat Unlikely to Affect Norbord (OSB) Stock Price

News stories about Norbord (NYSE:OSB) have been trending somewhat positive recently, according to Accern. Accern identifies negative and positive media coverage by analyzing more than twenty million news and blog sources in real-time. Accern ranks coverage of publicly-traded companies on a scale of negative one to one, with scores closest to one being the most favorable. Norbord earned a daily sentiment score of 0.05 on Accern’s scale. Accern also assigned news articles about the construction company an impact score of 45.5014696096595 out of 100, indicating that recent media coverage is somewhat unlikely to have an impact on the company’s share price in the immediate future.

Several equities analysts recently weighed in on OSB shares. Zacks Investment Research lowered shares of Norbord from a “buy” rating to a “hold” rating in a research report on Thursday, March 22nd. ValuEngine lowered shares of Norbord from a “strong-buy” rating to a “buy” rating in a research report on Monday, April 2nd. Credit Suisse Group lowered shares of Norbord from an “outperform” rating to a “hold” rating and set a $54.00 price objective on the stock. in a research report on Tuesday, May 1st. BMO Capital Markets reaffirmed a “sell” rating and set a $33.00 price objective on shares of Norbord in a research report on Tuesday, April 24th. Finally, Bank of America raised their price objective on shares of Norbord from $34.00 to $35.00 and gave the company an “underperform” rating in a research report on Friday, May 4th. Two equities research analysts have rated the stock with a sell rating, six have assigned a hold rating, one has issued a buy rating and one has issued a strong buy rating to the company. The company has a consensus rating of “Hold” and a consensus target price of $42.43.

Get Norbord alerts:

Shares of Norbord traded down $0.43, reaching $41.20, during trading on Thursday, Marketbeat.com reports. The stock had a trading volume of 2,459 shares, compared to its average volume of 92,438. Norbord has a 52 week low of $30.49 and a 52 week high of $45.45. The firm has a market cap of $3.61 billion, a price-to-earnings ratio of 9.18, a P/E/G ratio of 1.01 and a beta of 2.56. The company has a quick ratio of 1.28, a current ratio of 2.22 and a debt-to-equity ratio of 0.51.

Norbord (NYSE:OSB) last released its quarterly earnings results on Thursday, May 3rd. The construction company reported $1.10 EPS for the quarter, missing the Zacks’ consensus estimate of $1.22 by ($0.12). Norbord had a net margin of 21.08% and a return on equity of 45.94%. The firm had revenue of $576.00 million during the quarter. research analysts predict that Norbord will post 4.78 EPS for the current fiscal year.

The company also recently declared a quarterly dividend, which was paid on Thursday, June 21st. Stockholders of record on Friday, June 1st were given a $0.4683 dividend. This represents a $1.87 dividend on an annualized basis and a dividend yield of 4.55%. The ex-dividend date was Thursday, May 31st. Norbord’s dividend payout ratio is 41.20%.

About Norbord

Norbord Inc manufactures and sells wood-based panels for retail chains, contractor supply yards, and industrial manufacturers primarily in North America and Europe. The company offers oriented strand boards for use in sheathing, flooring, and roofing in home construction applications; particleboards that are used in flooring and other construction applications; and medium density fiberboards for use in cabinet doors, mouldings, and interior wall paneling applications, as well as related value-added products for use in the construction of new homes, and renovation and repair of existing structures.

Insider Buying and Selling by Quarter for Norbord (NYSE:OSB)

Thursday, July 5, 2018

Johnson Matthey (JMAT) Given New GBX 4,300 Price Target at Berenberg Bank

Johnson Matthey (LON:JMAT) had its price target boosted by Berenberg Bank from GBX 3,680 ($48.99) to GBX 4,300 ($57.25) in a research report sent to investors on Tuesday morning. They currently have a buy rating on the stock.

Several other research firms also recently commented on JMAT. Deutsche Bank boosted their target price on shares of Johnson Matthey from GBX 3,570 ($47.53) to GBX 4,500 ($59.91) and gave the stock a buy rating in a research report on Friday, June 15th. Morgan Stanley reaffirmed an overweight rating and set a GBX 3,900 ($51.92) price objective on shares of Johnson Matthey in a report on Monday, June 4th. Liberum Capital raised shares of Johnson Matthey to a buy rating and upped their price objective for the stock from GBX 3,300 ($43.94) to GBX 4,000 ($53.26) in a report on Monday, June 4th. Deutsche Bank reaffirmed a buy rating on shares of Johnson Matthey in a report on Friday, June 1st. Finally, Citigroup reaffirmed a buy rating on shares of Johnson Matthey in a report on Tuesday, May 29th. One research analyst has rated the stock with a sell rating, one has assigned a hold rating and eight have assigned a buy rating to the stock. The stock has a consensus rating of Buy and a consensus target price of GBX 3,816.67 ($50.81).

Get Johnson Matthey alerts:

JMAT stock opened at GBX 3,510 ($46.73) on Tuesday. Johnson Matthey has a 12 month low of GBX 2,681 ($35.69) and a 12 month high of GBX 3,511 ($46.74).

Johnson Matthey (LON:JMAT) last posted its earnings results on Thursday, May 31st. The company reported GBX 208.40 ($2.77) EPS for the quarter, topping the Thomson Reuters’ consensus estimate of GBX 207.90 ($2.77) by GBX 0.50 ($0.01). Johnson Matthey had a net margin of 2.60% and a return on equity of 14.99%.

The company also recently disclosed a dividend, which will be paid on Tuesday, August 7th. Investors of record on Thursday, June 7th will be issued a dividend of GBX 58.25 ($0.78) per share. This is an increase from Johnson Matthey’s previous dividend of $21.75. This represents a dividend yield of 1.66%. The ex-dividend date of this dividend is Thursday, June 7th.

In related news, insider Anna Manz bought 12 shares of the business’s stock in a transaction that occurred on Wednesday, May 16th. The stock was purchased at an average cost of GBX 3,493 ($46.51) per share, for a total transaction of 拢419.16 ($558.06). Also, insider Robert MacLeod bought 9 shares of the business’s stock in a transaction that occurred on Wednesday, June 20th. The shares were bought at an average price of GBX 3,790 ($50.46) per share, with a total value of 拢341.10 ($454.13). Over the last ninety days, insiders have purchased 33 shares of company stock valued at $115,242.

About Johnson Matthey

Johnson Matthey is a global leader in science that enables a cleaner and healthier world. With over 200 years of sustained commitment to innovation and technological breakthroughs, they improve the function, performance and safety of their customers�� products. Their science has a global impact in areas such as low emission transport, pharmaceuticals, chemical processing and making the most efficient use of the planet��s natural resources.

Analyst Recommendations for Johnson Matthey (LON:JMAT)

Sunday, June 24, 2018

Worthington Industries, Inc. (WOR) Expected to Post Quarterly Sales of $935.34 Million

Wall Street analysts expect Worthington Industries, Inc. (NYSE:WOR) to report sales of $935.34 million for the current quarter, according to Zacks Investment Research. Two analysts have provided estimates for Worthington Industries’ earnings. The highest sales estimate is $971.00 million and the lowest is $899.68 million. Worthington Industries posted sales of $845.34 million during the same quarter last year, which would indicate a positive year over year growth rate of 10.6%. The firm is expected to announce its next earnings report on Wednesday, June 27th.

According to Zacks, analysts expect that Worthington Industries will report full year sales of $3.50 billion for the current year, with estimates ranging from $3.46 billion to $3.53 billion. For the next financial year, analysts forecast that the business will report sales of $3.73 billion per share, with estimates ranging from $3.63 billion to $3.84 billion. Zacks Investment Research’s sales averages are an average based on a survey of sell-side analysts that cover Worthington Industries.

Get Worthington Industries alerts:

Worthington Industries (NYSE:WOR) last issued its earnings results on Thursday, March 29th. The industrial products company reported $0.61 earnings per share for the quarter, missing the consensus estimate of $0.75 by ($0.14). The firm had revenue of $841.66 million during the quarter, compared to the consensus estimate of $863.50 million. Worthington Industries had a return on equity of 17.05% and a net margin of 6.47%. The company’s quarterly revenue was up 19.6% on a year-over-year basis. During the same period in the prior year, the company posted $0.55 EPS.

Several brokerages recently weighed in on WOR. ValuEngine downgraded shares of Worthington Industries from a “buy” rating to a “hold” rating in a report on Wednesday, May 2nd. Jefferies Financial Group reaffirmed a “hold” rating and issued a $45.00 target price on shares of Worthington Industries in a report on Friday, March 30th. Finally, Zacks Investment Research downgraded shares of Worthington Industries from a “hold” rating to a “strong sell” rating in a report on Saturday, April 7th.

Worthington Industries stock traded up $0.28 during mid-day trading on Tuesday, hitting $47.94. The stock had a trading volume of 9,287 shares, compared to its average volume of 250,633. The company has a market capitalization of $2.98 billion, a P/E ratio of 14.88, a P/E/G ratio of 3.40 and a beta of 1.08. The company has a debt-to-equity ratio of 0.72, a quick ratio of 1.29 and a current ratio of 2.05. Worthington Industries has a one year low of $39.52 and a one year high of $53.27.

The business also recently disclosed a quarterly dividend, which will be paid on Friday, June 29th. Shareholders of record on Friday, June 15th will be issued a dividend of $0.21 per share. This represents a $0.84 annualized dividend and a dividend yield of 1.75%. The ex-dividend date of this dividend is Thursday, June 14th. Worthington Industries’s dividend payout ratio (DPR) is presently 26.09%.

In related news, Director Michael J. Endres acquired 3,000 shares of the company’s stock in a transaction on Wednesday, April 4th. The stock was acquired at an average price of $39.78 per share, with a total value of $119,340.00. Following the acquisition, the director now directly owns 187,440 shares of the company’s stock, valued at $7,456,363.20. The purchase was disclosed in a legal filing with the SEC, which is accessible through this link. Also, VP Catherine M. Lyttle sold 34,500 shares of the stock in a transaction dated Wednesday, April 4th. The shares were sold at an average price of $40.65, for a total transaction of $1,402,425.00. Following the transaction, the vice president now directly owns 32,059 shares of the company’s stock, valued at approximately $1,303,198.35. The disclosure for this sale can be found here. 31.30% of the stock is owned by corporate insiders.

Hedge funds and other institutional investors have recently made changes to their positions in the company. PDS Planning Inc purchased a new stake in shares of Worthington Industries during the 1st quarter valued at about $185,000. Raymond James Financial Services Advisors Inc. purchased a new stake in shares of Worthington Industries during the 4th quarter valued at about $218,000. Xact Kapitalforvaltning AB purchased a new stake in shares of Worthington Industries during the 4th quarter valued at about $221,000. Elkfork Partners LLC purchased a new stake in shares of Worthington Industries during the 4th quarter valued at about $234,000. Finally, Flinton Capital Management LLC raised its position in shares of Worthington Industries by 24.2% during the 4th quarter. Flinton Capital Management LLC now owns 6,460 shares of the industrial products company’s stock valued at $285,000 after buying an additional 1,258 shares in the last quarter. Hedge funds and other institutional investors own 50.36% of the company’s stock.

Worthington Industries Company Profile

Worthington Industries, Inc, a metals manufacturing company, focuses on value-added steel processing and manufactured metal products in the United States, Austria, Canada, Mexico, Poland, Portugal, and Turkey. The company operates through three segments: Steel Processing, Pressure Cylinders, and Engineered Cabs.

Get a free copy of the Zacks research report on Worthington Industries (WOR)

For more information about research offerings from Zacks Investment Research, visit Zacks.com

Earnings History and Estimates for Worthington Industries (NYSE:WOR)

Monday, May 28, 2018

Flinton Capital Management LLC Purchases 145,404 Shares of Gap Inc (GPS)

Flinton Capital Management LLC boosted its position in Gap Inc (NYSE:GPS) by 182.3% during the first quarter, according to the company in its most recent 13F filing with the SEC. The fund owned 225,148 shares of the apparel retailer’s stock after buying an additional 145,404 shares during the quarter. Flinton Capital Management LLC owned approximately 0.06% of GAP worth $7,025,000 as of its most recent filing with the SEC.

A number of other institutional investors have also recently made changes to their positions in the stock. Hermes Investment Management Ltd. raised its position in GAP by 7.3% in the 4th quarter. Hermes Investment Management Ltd. now owns 29,252 shares of the apparel retailer’s stock valued at $996,000 after buying an additional 2,000 shares during the last quarter. Amalgamated Bank raised its position in GAP by 9.8% in the 4th quarter. Amalgamated Bank now owns 29,655 shares of the apparel retailer’s stock valued at $1,010,000 after buying an additional 2,644 shares during the last quarter. Xact Kapitalforvaltning AB raised its position in GAP by 9.6% in the 4th quarter. Xact Kapitalforvaltning AB now owns 32,336 shares of the apparel retailer’s stock valued at $1,101,000 after buying an additional 2,819 shares during the last quarter. San Francisco Sentry Investment Group CA raised its position in GAP by 543.3% in the 4th quarter. San Francisco Sentry Investment Group CA now owns 3,493 shares of the apparel retailer’s stock valued at $119,000 after buying an additional 2,950 shares during the last quarter. Finally, Gyroscope Capital Management Group LLC raised its position in GAP by 1.6% in the 4th quarter. Gyroscope Capital Management Group LLC now owns 200,465 shares of the apparel retailer’s stock valued at $6,828,000 after buying an additional 3,181 shares during the last quarter. 58.68% of the stock is currently owned by institutional investors and hedge funds.

Get GAP alerts:

A number of brokerages recently issued reports on GPS. JPMorgan Chase & Co. reissued a “neutral” rating and issued a $28.00 target price (up previously from $24.00) on shares of GAP in a research report on Wednesday, February 21st. BMO Capital Markets lifted their target price on GAP from $29.00 to $35.00 and gave the company a “market perform” rating in a research report on Friday, March 2nd. Credit Suisse Group lowered their price target on GAP from $35.00 to $33.00 and set a “neutral” rating on the stock in a research report on Friday. ValuEngine raised GAP from a “hold” rating to a “buy” rating in a research report on Thursday. Finally, Deutsche Bank lowered their price target on GAP from $34.00 to $33.00 and set a “hold” rating on the stock in a research report on Friday. Three equities research analysts have rated the stock with a sell rating, nineteen have issued a hold rating and seven have assigned a buy rating to the company. The stock presently has a consensus rating of “Hold” and an average target price of $32.88.

In related news, CEO Jeff Kirwan sold 101,820 shares of the business’s stock in a transaction on Monday, March 5th. The stock was sold at an average price of $33.73, for a total value of $3,434,388.60. Following the completion of the sale, the chief executive officer now directly owns 101,820 shares in the company, valued at approximately $3,434,388.60. The transaction was disclosed in a filing with the Securities & Exchange Commission, which is accessible through the SEC website. Also, Director William Sydney Fisher sold 500,000 shares of the business’s stock in a transaction on Thursday, March 22nd. The shares were sold at an average price of $32.10, for a total value of $16,050,000.00. Following the completion of the sale, the director now owns 11,530,396 shares of the company’s stock, valued at $370,125,711.60. The disclosure for this sale can be found here. Insiders sold a total of 1,770,425 shares of company stock valued at $57,824,673 over the last 90 days. 27.30% of the stock is currently owned by corporate insiders.

GAP opened at $28.15 on Friday, MarketBeat.com reports. The company has a current ratio of 1.86, a quick ratio of 1.04 and a debt-to-equity ratio of 0.40. The company has a market cap of $10.96 billion, a P/E ratio of 12.85, a price-to-earnings-growth ratio of 1.35 and a beta of 0.84. Gap Inc has a 1-year low of $21.02 and a 1-year high of $35.68.

GAP (NYSE:GPS) last posted its earnings results on Thursday, May 24th. The apparel retailer reported $0.42 earnings per share for the quarter, missing analysts’ consensus estimates of $0.46 by ($0.04). The business had revenue of $3.78 billion for the quarter, compared to analyst estimates of $3.60 billion. GAP had a return on equity of 28.41% and a net margin of 5.36%. The firm’s revenue was up 10.0% compared to the same quarter last year. During the same period in the previous year, the firm posted $0.36 earnings per share. equities analysts forecast that Gap Inc will post 2.58 EPS for the current year.

The company also recently declared a quarterly dividend, which will be paid on Wednesday, August 1st. Investors of record on Wednesday, July 11th will be paid a $0.2425 dividend. The ex-dividend date of this dividend is Tuesday, July 10th. This represents a $0.97 annualized dividend and a yield of 3.45%. GAP’s dividend payout ratio (DPR) is presently 45.54%.

About GAP

The Gap, Inc operates as an apparel retail company worldwide. The company offers apparel, accessories, and personal care products for men, women, and children under the Old Navy, Gap, Banana Republic, Athleta, and Intermix brands. Its products include denim, tees, button-downs, khakis, and other products; and fitness and lifestyle products for use in yoga, training, sports, travel, and everyday activities to women and girls.

Want to see what other hedge funds are holding GPS? Visit HoldingsChannel.com to get the latest 13F filings and insider trades for Gap Inc (NYSE:GPS).

Institutional Ownership by Quarter for GAP (NYSE:GPS)

Sunday, May 27, 2018

Hercules Technology Growth Capital (HTGC) and Solar Senior Capital (SUNS) Head-To-Head Comparison

Hercules Technology Growth Capital (NYSE: HTGC) and Solar Senior Capital (NASDAQ:SUNS) are both small-cap finance companies, but which is the superior business? We will compare the two businesses based on the strength of their risk, profitability, dividends, institutional ownership, valuation, analyst recommendations and earnings.

Dividends

Get Hercules Technology Growth Capital alerts:

Hercules Technology Growth Capital pays an annual dividend of $1.24 per share and has a dividend yield of 10.0%. Solar Senior Capital pays an annual dividend of $1.41 per share and has a dividend yield of 8.4%. Hercules Technology Growth Capital pays out 106.9% of its earnings in the form of a dividend, suggesting it may not have sufficient earnings to cover its dividend payment in the future. Solar Senior Capital pays out 100.0% of its earnings in the form of a dividend, suggesting it may not have sufficient earnings to cover its dividend payment in the future.

Profitability

This table compares Hercules Technology Growth Capital and Solar Senior Capital’s net margins, return on equity and return on assets.

Net Margins Return on Equity Return on Assets
Hercules Technology Growth Capital 46.86% 12.02% 6.19%
Solar Senior Capital 67.60% 8.38% 4.42%

Institutional and Insider Ownership

39.0% of Hercules Technology Growth Capital shares are owned by institutional investors. Comparatively, 25.7% of Solar Senior Capital shares are owned by institutional investors. 3.2% of Hercules Technology Growth Capital shares are owned by company insiders. Comparatively, 5.6% of Solar Senior Capital shares are owned by company insiders. Strong institutional ownership is an indication that hedge funds, endowments and large money managers believe a company will outperform the market over the long term.

Volatility and Risk

Hercules Technology Growth Capital has a beta of 0.73, meaning that its share price is 27% less volatile than the S&P 500. Comparatively, Solar Senior Capital has a beta of 0.59, meaning that its share price is 41% less volatile than the S&P 500.

Analyst Ratings

This is a breakdown of recent recommendations and price targets for Hercules Technology Growth Capital and Solar Senior Capital, as reported by MarketBeat.

Sell Ratings Hold Ratings Buy Ratings Strong Buy Ratings Rating Score
Hercules Technology Growth Capital 0 1 9 0 2.90
Solar Senior Capital 0 0 0 0 N/A

Hercules Technology Growth Capital presently has a consensus target price of $14.58, suggesting a potential upside of 17.35%. Given Hercules Technology Growth Capital’s higher probable upside, equities research analysts clearly believe Hercules Technology Growth Capital is more favorable than Solar Senior Capital.

Valuation and Earnings

This table compares Hercules Technology Growth Capital and Solar Senior Capital’s gross revenue, earnings per share (EPS) and valuation.

Gross Revenue Price/Sales Ratio Net Income Earnings Per Share Price/Earnings Ratio
Hercules Technology Growth Capital $190.88 million 5.59 $78.99 million $1.16 10.71
Solar Senior Capital $32.17 million 8.35 $23.38 million $1.41 11.87

Hercules Technology Growth Capital has higher revenue and earnings than Solar Senior Capital. Hercules Technology Growth Capital is trading at a lower price-to-earnings ratio than Solar Senior Capital, indicating that it is currently the more affordable of the two stocks.

Summary

Hercules Technology Growth Capital beats Solar Senior Capital on 9 of the 15 factors compared between the two stocks.

Hercules Technology Growth Capital Company Profile

Hercules Capital, Inc., formerly known as Hercules Technology Growth Capital, Inc., is a business development company specializing in providing venture debt, debt, senior secured loans, and growth capital to privately held venture capital-backed companies at all stages of development from startups, to expansion stage including select publicly listed companies and select special opportunity lower middle market companies that require additional capital to fund acquisitions, recapitalizations and refinancing and established-stage companies. The firm provides growth capital financing solutions for capital extension; management buy-out and corporate spin-out financing solutions; company, asset specific, or intellectual property acquisition financing; convertible, subordinated and/or mezzanine loans; domestic and international corporate expansion; vendor financing; revenue acceleration by sales and marketing development, and manufacturing expansion. It provides asset-based financing with a focus on cash flow; accounts receivable facilities; equipment loans or leases; equipment acquisition; facilities build-out and/or expansion; working capital revolving lines of credit; inventory. The firm also provides bridge financing to IPO or mergers and acquisitions or technology acquisition; dividend recapitalizations and other sources of investor liquidity; cash flow financing to protect against share price volatility; competitor acquisition; pre-IPO financing for extra cash on the balance sheet; public company financing to continue asset growth and production capacity; short-term bridge financing; and strategic and intellectual property acquisition financings. It also focuses on customized financing solutions, seed, startups, early stage, emerging growth, mid venture, and late venture financing. The firm invests primarily in structured debt with warrants and, to a lesser extent, in senior debt and equity investments. The firm generally seeks to invest in companies that have been operating for at least six to 12 months prior to the date of their investment. It prefers to invest in technology, energy technology, sustainable and renewable technology, and life sciences. Within technology the firm focuses on advanced specialty materials and chemicals; communication and networking, consumer and business products; consumer products and services, digital media and consumer internet; electronics and computer hardware; enterprise software and services; gaming; healthcare services; information services; business services; media, content and information; mobile; resource management; security software; semiconductors; semiconductors and hardware; and software sector. Within energy technology, it invests in agriculture; clean technology; energy and renewable technology, fuels and power technology; geothermal; smart grid and energy efficiency and monitoring technologies; solar; and wind. Within life sciences, the firm invests in biopharmaceuticals; biotechnology tools; diagnostics; drug discovery, development and delivery; medical devices and equipment; surgical devices; therapeutics; pharma services; and specialty pharmaceuticals. It also invests in educational services. The firm invests primarily in United States based companies and considers investment in the West Coast, Mid-Atlantic regions, Southeast and Midwest; particularly in the areas of software, biotech and information services. It invests generally between $1 million to $40 million in companies with revenues of $10 million to $200 million, generating EBITDA of $2 million to $15 million, focused primarily on business services, communications, electronics, hardware, and healthcare services. The firm invests primarily in private companies but also have investments in public companies. For equity investments, the firm seeks to represent a controlling interest in its portfolio companies which may exceed 25% of the voting securities of such companies. The firm seeks to invest a limited portion of its assets in equipment-based loans to early-stage prospective portfolio companies. These loans are generally for amounts up to $3 million but may be up to $15 million for certain energy technology venture investments. The firm allows certain debt investments have the right to convert a portion of the debt investment into equity. It also co-invests with other private equity firms. The firm seeks to exit its investments through initial public offering, a private sale of equity interest to a third party, a merger or an acquisition of the company or a purchase of the equity position by the company or one of its stockholders. The firm has structured debt with warrants which typically have maturities of between two and seven years with an average of three years; senior debt with an investment horizon of less than three years; equipment loans with an investment horizon ranging from three to four years; and equity related securities with an investment horizon ranging from three to seven years. Hercules Capital, Inc. was founded in December 2003 and is based in Palo Alto, California with additional offices in Hartford, Connecticut; Boston, Massachusetts; Elmhurst, Illinois; Santa Monica, California; McLean, Virginia; New York, New York; Radnor, Pennsylvania; and Washington, District of Columbia.

Solar Senior Capital Company Profile

Solar Senior Capital Ltd. is a closed-end, externally managed, non-diversified management investment company. The Company’s investment objective is to seek to maximize current income consistent with the preservation of capital. The Company seeks to achieve its investment objective by directly and indirectly investing in senior loans, including first lien, unitranche, and second lien debt instruments, made to private middle-market companies whose debt is rated below investment grade, which it refers to collectively as senior loans. It may also invest in debt of public companies that are thinly traded or in equity securities. Under normal market conditions, at least 80% of the value of its net assets (including the amount of any borrowings for investment purposes) will be invested in senior loans. It invests in privately held the United States middle-market companies. Its investment activities are managed by Solar Capital Partners, LLC (Solar Capital Partners or the Investment Advisor).